Evaluation
The new semi-virtual conference format was evaluated in four different ways. All conference participants were encouraged to take part in at least one of these evaluations.
Interviews. During the conference, some participants were approached by two colleagues (one holding a video camera) and invited to talk about any issue related to the new semi-virtual conference format. From the videos collected at all hubs, we produced a documentary video. The project was organized by John Sloboda, who attended the Graz hub.
Survey. Participants were encouraged to participate in a survey and answer seven short questions. Participation was possible on Thursday and Friday. On Saturday morning in Graz, we carried out a preliminary analysis and presented a quick summary at the closing session on Saturday afternoon. The main result is shown in the following graph.
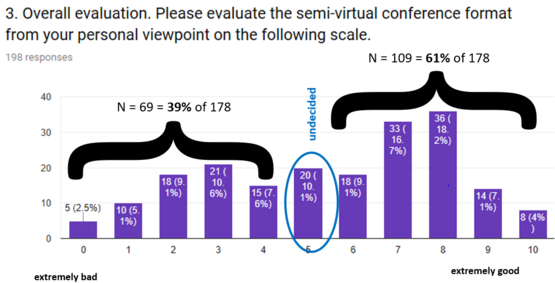
The graph shows that over 60% of about 200 participants taking part in the survey approved of the new format. Not shown are the differences between hubs. Satisfaction was highest in La Plata where most participants could not have participated otherwise, for financial reasons. It was lowest in Montreal, to which many US participants flew although many may have preferred to fly to Graz. The solution in the future may be to promote two kinds of equality:
- Equal distances between time zones. Montreal was close to European time and a long way from Sydney time. A West-US hub would have solved this problem. People at such a hub would have felt more integrated, watching presentations from Graz in the morning and Sydney in the late afternoon.
- Equal number of participants at different hubs. The Graz hub had about 300 participants which was twice as many as Montreal. The participants in Montreal would have felt more part of the conference if these two numbers had been more equal. That said, participants in La Plata and Sydney also enjoyed the conference although there were only about 100 in La Plata and 50 in Sydney.
Discussion. Evaluation sessions were scheduled for Friday and Saturday. The meetings in Graz and Sydney were local only, whereas La Plata and Montreal shared the meeting using Zoom. A chair introduced each session, after which the audience discussed the advantages and disadvantages of the semi-virtual conference format or other possible formats. A student assistant took minutes and the chair reported briefly to the closing session. Written reports are available from the conference organizer.
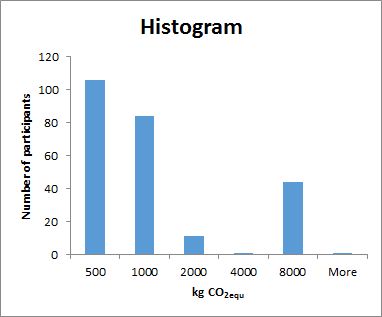
Carbon footprint calculation. The effective carbon footprint (greenhouse gas emissions) of the conference from flying was estimated by documenting the travel arrangments of the participants and comparing with comparable previous conferences, both overall and per participant. The project was carried out in collaboration with the Wegener Centre for Climate and Global Change in Graz. The main result is shown in the following graph. The horizontal axis is emissions per participant. The vertical bar at "8000 kg CO2eq" represents the number of participants who emitted between 4000 and 8000 kg CO2 equivalent traveling to and from the conference. The figure shows how conference participants who flew separated into two groups. About 190 were short-distance flyers (left) who emitted less than one tonne CO2 equivalent per person, and about 50 were long-distance flyers (right) who emitted more than four tonnes each. The best way to reduce total emissions in the future is to increase the number of hubs to reduce the number of long-distance flyers (e.g., extra hubs in India and Japan). This strategy could also reduce the number of short-distance flyers (e.g., an extra hub in North America).